Don,
If you want to compare the two you need to plot them both on one graph, with identical x and y axis.
These graphs are different and it is VERY difficult to compare what the graphs are showing.
You could take one graph, and plot the curves of the other on it, and then compare the lines for HP and Torque fairly easily.
Looking at them as they are now makes it a lot harder to do.
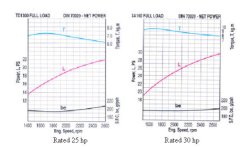
When plotted on one graph, I think you will find that both the torque and HP traces for the 25 HP engine will be below those of the 30 HP engine. Which is what would be expected.
You can actually see that looking at the ends of the curves of the two graphs as is.
Not sure if this helps or not. If both engine characteristics were plotted on the same graph, it looks like the torque curves might not be that different over the RPM range shown. The 30 hp engine torque would greater naturally, but the percent change with engine speed looks like it might be very similar.