mistermcgoo
Bronze Member
- Joined
- May 13, 2011
- Messages
- 52
Some interesting charts from Global Climate Change Indicators show the Evidence - Climate Change - AccuWeather.com
View attachment 289784
View attachment 289785
View attachment 289786
View attachment 289787
View attachment 289788
Of course it is all lies and scheming GW stuff- somehow the dollars will do a rainbow arc from your pocket to mine- you must be a leprechaun denier!
_______________________________
Explaining the Hurricane and Climate change Link
September 07, 2012; 7:26 PM
"And because of that, as the temperature gets warmer and warmer, ironically it becomes more difficult to start a hurricane, even though once you start a hurricane, potentially it can become more intense, so you have these two contradictory things going on."
Explaining the Hurricane and Climate change Link - Climate Change - AccuWeather.com
_________________________________________________________
re Tornadoes:
"2. Significant severe weather (tornadoes and hail storms) depend more on wind shear (change in direction of strong winds with height) rather than a combination of heat and high humidity. Shear also determines the intensity of hail and tornadoes in the U.S. and Europe. Big tornado years have hail storms as the dominant secondary severe weather events (as opposed to just damaging winds).
3. Climate models projecting a future warmer world with C02 doubled show an increase in heat and humidity, but a decrease in shear (a decrease in equator to pole gradient).
4. These high heat/humidity & low shear environments result in little overall change in severe thunderstorms. However, there may be a slight decrease in tornadoes due to less shear and an increase in significant thunderstorm straight-line wind events due to an increase in heat and humidity."
Climate Change and Severe Thunderstorms - Climate Change - AccuWeather.com
___________________________________________
If the charts are too small after you click on them for PC- hold ctrl key down as you push the shift key and + key
-for mackbook- instead of the ctrl key use the command key
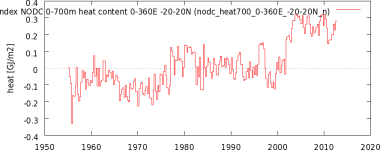
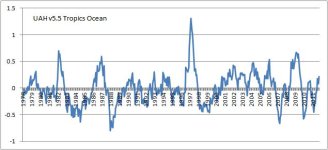
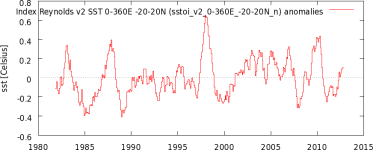
One thing at a time. First look at the ocean heat content graph. Bar charts tend to muddle the data whereby certain behavior of it go unnoticed, so please view the attached OHC as is reported from the tropics region. Note the step change from 2002 to 2003. This was the transition from XBT (expendable bathythermograph) to the ARGO float system; the data was spliced. This is a known issue and has never been fully resolved. Neither SST or TLT show this unphysical step change. Please note it is in this region where AGW "theory" states should be warming rapidly; the ubiquitous missing "hot spot" resulting from the so-called enhanced greenhouse effect which is not observed. Note since 2003 when ARGO was in place OHC in the upper 700m has not increased in the tropics and is in fact decreasing. Also note even in your graph global OHC has leveled out for 9 years. There is a good bit of history since 2006 concerning how OHC is measured and it is not based solely on empirical data.

UAH lower tropical troposphere through Sept 2012

SST in the tropics through Oct 2012

Once you can explain why AGW isn't occurring as advertised in the tropics where it should be ramping up, we can move on to another in your list.
Data sources here Climate Explorer: Starting point
Last edited:
