No,they,[the powers who be],,are a lot more considerating,[is that a word?],,than they used to be,,,this is a political topic,,no doubt,,,[made a post saying so several pages back],,,so,to all you new comers,,,we are having way more freedom of speech here than we used to,,[take it from a guy who was barred from here 2-3 times],,I like it now,,but you just gotta remember,they are other people listening,,who may not share your enthusiasm,,so,,,,anyways,,,its better by far than it was,,,,thingy
You are using an out of date browser. It may not display this or other websites correctly.
You should upgrade or use an alternative browser.
You should upgrade or use an alternative browser.
Climate Change Discussion
- Thread starter hazmat
- Start date
- Views: 27698
- Status
- Not open for further replies.
/ Climate Change Discussion
#231
CRJCaptain
Silver Member
- Joined
- Jul 4, 2003
- Messages
- 133
- Tractor
- Bobcat Toolcat 5600
EddieWalker said:Global Warming has failed my simple test. Reading the full report is a waste of time since those who are writing it are proven liers with political agendas.
Here is a good site that spends there time examining and debunking these people.
JunkScience.com -- Steven Milloy, Publisher
Eddie
Propaganda alert:
Speaking of people with political agendas, Steven Milloy is a paid lobbyist and advocate for ExxonMobil and others...he might not be the most objective authority on the topic of climate change.
CRJCaptain
Silver Member
- Joined
- Jul 4, 2003
- Messages
- 133
- Tractor
- Bobcat Toolcat 5600
dmccarty said:The gas causing the greatest global warming is water vapor. But Gore is not running around telling people to take less showers.Thankfully.
Not exactly...water vapor is more effective at re-rediating long wave heat back to the earth, but it has a much shorter residence time in the atmosphere compared to carbon dioxide.
Check this out: Stoat: Water vapour is not the dominant greenhouse gas
Also:
RealClimate » Water vapour: feedback or forcing?
dmccarty said:The hockey, or should we call it the hokey stick, graph that is used to show human causes global warming has caused lots of controversy. One of the interesting things about it is that it only goes back 1000 years. Since one side of this argument is that there is a natural temperature swing every 1500 years or so why does the graph only go back 1,000 years? Why not 1500 or 3000. Would that not be a better measurement to show a true trend over time?
The first hockey stick graph published by the UN was done by two non scientists who refused to show their data on how they created the graph. Lots of controversy every since.
Later,
Dan
Here's a link to data from the Vostok Antarctic ice cores that looks back 650,000 years. Have a look and tell me what you think:
RealClimate » 650,000 years of greenhouse gas concentrations 650 000 années de concentrations de gaz à effet de serre
Tig
Veteran Member
Some good links there captain. Thanks.
I particularly enjoyed the RealClimate site. The discussion there shows some of the thought, research and debate that is going into climate science.
I particularly enjoyed the RealClimate site. The discussion there shows some of the thought, research and debate that is going into climate science.
dmccarty
Super Star Member
So you have a source that says A I have read something that says Not A. Which is true? I was reading some Global Warming sites over the last couple of weeks due to this thread and there was a qoute from one scientist about water vapor that I can't find anymore. I thought it was on Wikipedia so maybe it got edited out. Anywho, one way his qoute could be taken was that we aren't going to look at water vapor influence since we cant do anything about it.
The other link about the ice cores is pretty vague to me. Maybe you can explain the graph better. To me it looks like there is rising and faling CO2 levels over long periods of time. Periods of time without human activity. But I could be wrong since the graph is not titles clearly.
AND this graph while it goes back over 1000's year, well I think it does, that does not explain away that data in the Hockey Stick. One of the the most dramtic lines of data in the Hockey Stick graph is from data that is only a few hundred years old. Hardly long enough. If a few of the data lines are incorrect or inaccurate the graph's meaning changes. The most "scary" part of the graph was the sharp rise that has occurred not the overall temperature level.
HOW is the temperature measured? And at what locations? How is the drastic geographical changes that ARE caused by human activity acounted for in these measurements that blame CO2 gases for the temperature rise?
I sure don't know answers and I'm not sure THEY know the answers either. I left the house this morning in semi rural area and it was 26 degrees per the trucks thermometer. During the 45 minute trip the temp had a high of 31 and a low of 26. The temperature bounced around in that range depending on how near I was to a large lake, to the city, rural areas, shaded roads, unshaded roads not to mention gravel roads. I can see a couple degree difference when I go from blacktop to gravel on the road to my house. Given the huge growth in roads not to mention paved roads over the last 50 years what is the temperature impact? How is all of this accounted for in temperature rise?
In the summer it can be 10 degrees higher at my work, within a few miles of the airport, than at my house. The airport is where our local temperatures are recorded. It used to be in a very rural area. Now its bounded by development. That drives up the temperature. The weather station used to be in Raleigh before moving to the airport. Again, any comparisons between the two will be different. I can get on www.weatherunderground.com and check out weather stations near my house. Of the four stations that I use to check my local weather, the temps ranged this morning from 27 to 34. That is a big spread over some stations that are within 10 rural miles of each other.
In the early 1900's this county was almost completely farm fields, with a small amount of woods and towns. During the later part of the 1900s the farms had been replaced by woods with growing towns/citys and then by 2000 its a heck of a lot of city. That change in land use changes temperature. And this is world wide. How is these changes accounted vs CO2 is causing a temperature rise?
We are only talking about an increase in a couple of degrees of warming. But its the CO2 that does it. I really wonder if that is true. And I don't see my questions answered in the stuff I'm reading.
I'll keep looking.
Later,
Dan
IH3444
Veteran Member
- Joined
- Jan 10, 2004
- Messages
- 2,111
THE COLDEST AIRMASS OF THE WINTER SEASON ENTRENCHED ITSELF OVER THE GREAT LAKES FOR THE PAST WEEK MAKING THE START OF FEBRUARY VERY COLD! THROUGH THE FIRST 7 DAYS OF FEBRUARY...NORTHERN MICHIGAN IS EXPERIENCING AMONG THE TOP 10 COLDEST STARTS TO FEBRUARY IN THE LAST 100 YEARS. HERE IS THE DEPARTURE FROM NORMAL FOR SEVERAL LOCATIONS IN NORTHERN MICHIGAN THROUGH THE FIRST 6 DAYS OF FEBRUARY:
ALPENA: 8.4 (average) -8.6 (Departure from Normal)- 9TH COLDEST START
HOUGHTON LAKE: 5.2 (average) -12.8 (Departure from Normal) - 6TH COLDEST START
SAULT SAINTE MARIE: 4.8 (average) -8.7 (Departure from Normal)- 25TH COLDEST START
GAYLORD: 5.8 (average) -11.9 (Departure from Normal)-5TH COLDEST START
TRAVERSE CITY: 9.1 (average) -10.9 (Departure from Average)- 10TH COLDEST START
WEATHER SUMMARY:
The weather pattern across northern Michigan will remain the same for much of this upcoming week.
We are still locked in under a broad northwest wind regime with that colder air passing across the open waters of both Lake Michigan/Superior. That will continue to bring in occasional lake effect snow showers to the region all the way into the middle of next week. There will not be much change in our overall temperatures either with no signs of any real surge of warmth or bitter cold. Daytime high temperatures will remain in the teens with low temperatures in the single digits above zero. There will also be some sunshine intermingled with those lake effect clouds. Meteorologists Joe Charlevoix & Chief Meteorologist Greg MacMaster
CRJCaptain
Silver Member
- Joined
- Jul 4, 2003
- Messages
- 133
- Tractor
- Bobcat Toolcat 5600
dmccarty said:So you have a source that says A I have read something that says Not A. Which is true?
Hi Dan...you get extra points for reading through all that stuff, that's admirable. I think our sources are both true, to an extent, as they're both greenhouse gases. Where water vapor and CO2 differ is in their residence time, or how long the molecules actually remain as a gas in the atmosphere. Here's an excerpt from a discussion from my source above that explained it quite clearly:
(Note:GHG=greenhouse gas, WV=water vapor)
Water vapour is a "reactive" GHG with a short atmospheric lifetime of about 1 week. If you pump out a whole load of extra water vapour it won't stay in the atmosphere; it would condense as rain/snow and we'd be back to where we started. If you sucked the atmosphere dry of moisture, more would evaporate from the oceans. The balance is dynamic of course: humidity of the air varies by place and time, but its a stable balance.
In contrast, CO2 has a long lifetime (actually calculating a single "lifetime" for it doesn't work; but a given CO2 pulse such as we're supplying now will hang around for.. ohh... a century or more). It doesn't rain out (amusing factoid: the surface temperature of the deep interior Antarctica in winter can be colder than the freezing point of CO2; but this doesn't lead to CO2 snow (sadly, it would be fun) because the freezing point is lower because of the lower pressure because its higher up). So if you put in extra CO2 the climate warms a bit; because of this move WV evaporates (it doesn't have to, but just about all models show that the relative humidity tends to be about constant; so if you heat the atmos that means that the absolute humidity will increase). This in turn warms the atmosphere warms up a bit more; so more water gets evaporates. This is a positive feedback but a limited one: the increments (if you think of it that way) get smaller not larger so there is no runaway GH effect.
So: adding CO2 to the atmosphere warms it a bit and ends up with more WV. Adding WV does nothing much and the atmos returns to equilibrium. This is why WV is not the *dominant* GHG; its more like a submissive GHG
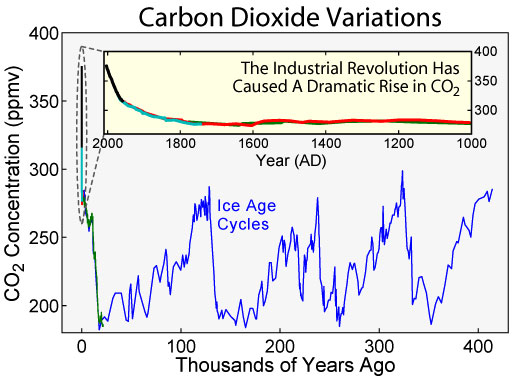
dmccarty said:The other link about the ice cores is pretty vague to me. Maybe you can explain the graph better. To me it looks like there is rising and faling CO2 levels over long periods of time. Periods of time without human activity. But I could be wrong since the graph is not titles clearly.
Your interpretation of the data is correct...it shows the natural variability of CO2 over a span of 650K years. It goes up and down in the absence of any human influence, and the highest it gets is 300 ppm approx 320,000 years ago. Where people should be alarmed is in looking at the present day CO2 levels, which presently sits at around 380 ppm!! This is the highest level ever recorded and is so far outside the natural variability so far seen. The "hockey stick" graph then is due to all of the increase coming in the last 100 years.
Here's a better link to the Vostok data with citations and graphical data:
TRENDS: ATMOSPHERIC CARBON DIOXIDE
A different version of the "hockey stick", from a different report:
dmccarty said:HOW is the temperature measured? And at what locations? How is the drastic geographical changes that ARE caused by human activity acounted for in these measurements that blame CO2 gases for the temperature rise?
In the early 1900's this county was almost completely farm fields, with a small amount of woods and towns. During the later part of the 1900s the farms had been replaced by woods with growing towns/citys and then by 2000 its a heck of a lot of city. That change in land use changes temperature. And this is world wide. How is these changes accounted vs CO2 is causing a temperature rise?
We are only talking about an increase in a couple of degrees of warming. But its the CO2 that does it. I really wonder if that is true. And I don't see my questions answered in the stuff I'm reading.
I'll keep looking.
Later,
Dan
You've got some great questions, Dan. The difference between rural and city local temperature variations that you mention is an actual climatological phenomenon known as "The Urban Heat Island" effect.
By the way, anyone who slogs through all this stuff receives extra credit to be applied towards the TBN atmospheric physics/climatology course!
Regards,
Dean
SPYDERLK
Super Star Member
- Joined
- Feb 28, 2006
- Messages
- 10,400
- Location
- VA
- Tractor
- JD2010, Kubota3450,2550, Mahindra 7520 w FEL w Skid Steer QC w/Tilt Tatch, & BH, BX1500
But in fact, global warming has actually adapted elements of all previous environmental crazies. It holds that carbon dioxide (a naturally-occurring compound that comprises a large portion of the atmosphere) is a form of pollution, the same as Carson's detested synthetic chemicals.
(Quote from A Necessary Apocalypse)
It seems to me that those who deny GW or are agnostic toward it are more prone to concentrate sequentially on narrow parts of the picture, to engage in sensational statements, and tend to amplify unknowns to bolster their arguments. Those who are making the case for it are coming at it more gently. They know what CO2 does, and of its miniscule atmospheric % thereby making its proportion much easier to affect. They don't know all the complexities, but are attempting to weight them and assess them more fully where needed to improve the accuracy of their predictions. They don't want to be responsible for not sounding an appropriate warning. They've got their work cut out for them. The money is on the other side. So is denial.
MikePA
Super Moderator
This is laughable. A series of UN panels have said we have (fill in number of years) to solve the problem before doomsday, talk about 'sensational' statements. And money? Who's funding all these UN studies that 'prove' GW? GW is all over the media for the same reason, it's sensational news. "World to end in 10 years, film at 11." These scientists have replaced Step 3 of the Scientific Method (Prove Hypothesis) with Step 3. Media Blitz. Make people feel guilty about their 'carbon footprint' and my goodness, the children, what are we doing to our children. Yes, yes, I will vote for more taxes to solve this problem, after all, it's for the children.SPYDERLK said:It seems to me that those who deny GW or are agnostic toward it are more prone to concentrate sequentially on narrow parts of the picture, to engage in sensational statements, and tend to amplify unknowns to bolster their arguments. Those who are making the case for it are coming at it more gently. The money is on the other side. So is denial.
Blaming man for GW is not science, it's conjecture, arrogance and hubris. 'Scientists' study and find 'evidence' of GW and the only hypothesis they can come up with is man caused it. Can it be a natural cycle? Can it be increased solar activity. NO, man caused it is the the theory. Puny, insignificant man, who can not change the weather tomorrow, can not predict the weather out a week, can not change the course of a hurricane, has not only caused GW but is the only one who can save the world from it.
And anyone who disagrees is a simpleton, if they could just learn more, understand more, be as smart as us, understand this complicated graph, those poor saps would understand. So sad. That leaves us no alternatives but to pass laws to enforce belief. Oh, and pass new taxes to rake in more dollars to solve this problem. Yes, more money into an 'GW Resolution Trust Fund' just like the Social Security Fund. Since solving this problem will take sooooo long, we'll need to collect this money for a long time. And we'll dispense some of it as grants, to scientists and think tanks, and universities to 'study' the problem more and develop solutions that will cost even more money to implement, so, unfortunately, yes, we'll need to raise your taxes again. Perhaps a few 'blue ribbon' panels, a cabinet position, a couple Congressional committees and, of course, a Department of Extreme Climatological Change (can't call it GW anymore, even though GW explains all weather extremes, GW might confuse the simpletons) with a few thousand bureaucrats.
If this were science there wouldn't be debate and 'views' about it nor the need for consensus. This debate about GW has all the attributes of a religious debate or a Windows vs Mac debate. It's anything but science.
- Status
- Not open for further replies.