Global Warming?

Status
Not open for further replies.
   / Global Warming? #1,851  
Who is talking about Galileo? I'm talking modern scientific studies of past warming events.
OK. Fair enuf. Modern study of todays warming events concludes that the situations are different. In every instance I would like to hear a full discussion of how they differ.
larry
 
   / Global Warming? #1,852  
OK. Fair enuf. Modern study of todays warming events concludes that the situations are different. In every instance I would like to hear a full discussion of how they differ.
larry

I don't see that they do.
 
   / Global Warming? #1,853  
It just Snowed in Africa for the first time in over 100 years.

Must be part of the Global Warming.
 
   / Global Warming? #1,854  
It just Snowed in Africa for the first time in over 100 years.

Must be part of the Global Warming.
 
   / Global Warming? #1,855  
Global Warming South African style! :laughing:
AzwOjPXCUAAZOkz.jpg
 
   / Global Warming? #1,859  
Rainbody - Pretty pathetic link you posted there.

http://climate.nasa.gov/evidence/

View attachment 276282

The Earth's climate has changed throughout history. Just in the last 650,000 years there have been seven cycles of glacial advance and retreat, with the abrupt end of the last ice age about 7,000 years ago marking the beginning of the modern climate era and of human civilization. Most of these climate changes are attributed to very small variations in Earthç—´ orbit that change the amount of solar energy our planet receives.

The current warming trend is of particular significance because most of it is very likely human-induced and proceeding at a rate that is unprecedented in the past 1,300 years.1

Earth-orbiting satellites and other technological advances have enabled scientists to see the big picture, collecting many different types of information about our planet and its climate on a global scale. Studying these climate data collected over many years reveal the signals of a changing climate.

Certain facts about Earth's climate are not in dispute:

The heat-trapping nature of carbon dioxide and other gases was demonstrated in the mid-19th century.2 Their ability to affect the transfer of infrared energy through the atmosphere is the scientific basis of many JPL-designed instruments, such as AIRS. Increased levels of greenhouse gases must cause the Earth to warm in response.

Ice cores drawn from Greenland, Antarctica, and tropical mountain glaciers show that the Earthç—´ climate responds to changes in solar output, in the Earthç—´ orbit, and in greenhouse gas levels. They also show that in the past, large changes in climate have happened very quickly, geologically-speaking: in tens of years, not in millions or even thousands.

Sea level rise
Global sea level rose about 17 centimeters (6.7 inches) in the last century. The rate in the last decade, however, is nearly double that of the last century.4

Global temperature rise
All three major global surface temperature reconstructions show that Earth has warmed since 1880. 5 Most of this warming has occurred since the 1970s, with the 20 warmest years having occurred since 1981 and with all 10 of the warmest years occurring in the past 12 years. 6 Even though the 2000s witnessed a solar output decline resulting in an unusually deep solar minimum in 2007-2009, surface temperatures continue to increase. 7

Warming oceans
The oceans have absorbed much of this increased heat, with the top 700 meters (about 2,300 feet) of ocean showing warming of 0.302 degrees Fahrenheit since 1969.8

Shrinking ice sheets
The Greenland and Antarctic ice sheets have decreased in mass. Data from NASA's Gravity Recovery and Climate Experiment show Greenland lost 150 to 250 cubic kilometers (36 to 60 cubic miles) of ice per year between 2002 and 2006, while Antarctica lost about 152 cubic kilometers (36 cubic miles) of ice between 2002 and 2005.

Declining Arctic sea ice
Both the extent and thickness of Arctic sea ice has declined rapidly over the last several decades. 9

Glacial retreat
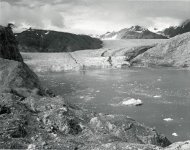
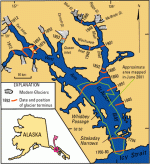
Glaciers are retreating almost everywhere around the world — including in the Alps, Himalayas, Andes, Rockies, Alaska and Africa.10

Extreme events
The number of record high temperature events in the United States has been increasing, while the number of record low temperature events has been decreasing, since 1950. The U.S. has also witnessed increasing numbers of intense rainfall events.11

Ocean acidification
Since the beginning of the Industrial Revolution, the acidity of surface ocean waters has increased by about 30 percent.12,13 This increase is the result of humans emitting more carbon dioxide into the atmosphere and hence more being absorbed into the oceans. The amount of carbon dioxide absorbed by the upper layer of the oceans is increasing by about 2 billion tons per year.14,15

References

1 IPCC Fourth Assessment Report, Summary for Policymakers, p. 5

B.D. Santer et.al., “A search for human influences on the thermal structure of the atmosphere,” Nature vol 382, 4 July 1996, 39-46

Gabriele C. Hegerl, “Detecting Greenhouse-Gas-Induced Climate Change with an Optimal Fingerprint Method,” Journal of Climate, v. 9, October 1996, 2281-2306

V. Ramaswamy et.al., “Anthropogenic and Natural Influences in the Evolution of Lower Stratospheric Cooling,” Science 311 (24 February 2006), 1138-1141

B.D. Santer et.al., “Contributions of Anthropogenic and Natural Forcing to Recent Tropopause Height Changes,” Science vol. 301 (25 July 2003), 479-483.

2 In the 1860s, physicist John Tyndall recognized the Earth's natural greenhouse effect and suggested that slight changes in the atmospheric composition could bring about climatic variations. In 1896, a seminal paper by Swedish scientist Svante Arrhenius first speculated that changes in the levels of carbon dioxide in the atmosphere could substantially alter the surface temperature through the greenhouse effect.

3 National Research Council (NRC), 2006. Surface Temperature Reconstructions For the Last 2,000 Years. National Academy Press, Washington, DC.

4 Church, J. A. and N.J. White (2006), A 20th century acceleration in global sea level rise, Geophysical Research Letters, 33, L01602, doi:10.1029/2005GL024826.

The global sea level estimate described in this work can be downloaded
from the CSIRO website.

5http://www.ncdc.noaa.gov/oa/climate/research/ anomalies/index.html

http://www.cru.uea.ac.uk/cru/data/temperature

http://data.giss.nasa.gov/gistemp

6 T.C. Peterson et.al., "State of the Climate in 2008," Special Supplement to the Bulletin of the American Meteorological Society, v. 90, no. 8, August 2009, pp. S17-S18.

7 I. Allison et.al., The Copenhagen Diagnosis: Updating the World on the Latest Climate Science, UNSW Climate Change Research Center, Sydney, Australia, 2009, p. 11

http://www.giss.nasa.gov/research/news/20100121/

http://science.nasa.gov/headlines/y2009/ 01apr_deepsolarminimum.htm

8 Levitus, et al, "Global ocean heat content 1955–2008 in light of recently revealed instrumentation problems," Geophys. Res. Lett. 36, L07608 (2009).

9 L. Polyak, et.al., “History of Sea Ice in the Arctic,” in Past Climate Variability and Change in the Arctic and at High Latitudes, U.S. Geological Survey, Climate Change Science Program Synthesis and Assessment Product 1.2, January 2009, chapter 7

R. Kwok and D. A. Rothrock, “Decline in Arctic sea ice thickness from submarine and ICESAT records: 1958-2008,” Geophysical Research Letters, v. 36, paper no. L15501, 2009

http://nsidc.org/sotc/sea_ice.html

10 National Snow and Ice Data Center

World Glacier Monitoring Service

11 http://lwf.ncdc.noaa.gov/extremes/cei.html

12 http://www.pmel.noaa.gov/co2/story/What+is+Ocean+Acidification? (Note: The pH of surface ocean waters has fallen by 0.1 pH units. Since the pH scale is logarithmic, this change represents approximately a 30 percent increase in acidity.)

13 http://www.pmel.noaa.gov/co2/story/Ocean+Acidification

14 C. L. Sabine et.al., “The Oceanic Sink for Anthropogenic CO2,” Science vol. 305 (16 July 2004), 367-371

15 Copenhagen Diagnosis, p. 36.

Don't worry - be happy!
 
   / Global Warming? #1,860  
Then there's the real history of C02;
The Real History of Carbon Dioxide Levels
| March 23, 2007 | Dr. John Ray


The Real History of C02 Levels

Prof. Beck's paper "180 YEARS OF ATMOSPHERIC CO2 GAS ANALYSIS BY CHEMICAL METHODS" has now been published in the journal Energy and Environment.

A PDF copy of the full paper can be obtained from the author: egbeck@biokurs.de.

The short version of Beck's paper can be found here: http://www.anenglishmanscastle.com/180_years_accurate_Co2_Chemical_Methods.pdf

(Note: Chart could not be cut and pasted. Go to GREENIE WATCH to see chart)

Excerpt below. It shows that actual past measurements of atmospheric CO2 have undergone great variation in levels from time to time in the period surveyed. Levels were not "flat" before the 20th century, as is usually asserted. There is a discussion of the paper here. I mentioned this matter previously on March 9th. -- where there is also a link to an early version of the full paper.

ABSTRACT

More than 90,000 accurate chemical analyses of CO2 in air since 1812 are summarised. The historic chemical data reveal that changes in CO2 track changes in temperature, and therefore climate in contrast to the simple, monotonically increasing CO2 trend depicted in the post-1990 literature on climate-change.

Since 1812, the CO2 concentration in northern hemispheric air has fluctuated exhibiting three high level maxima around 1825, 1857 and 1942 the latter showing more than 400 ppm. Between 1857 and 1958, the Pettenkofer process was the standard analytical method for determining atmospheric carbon dioxide levels, and usually achieved an accuracy better than 3%. These determinations were made by several scientists of Nobel Prize level distinction.

Following Callendar (1938), modern climatologists have generally ignored the historic determinations of CO2, despite the techniques being standard text book procedures in several different disciplines. Chemical methods were discredited as unreliable, choosing only few which fit the assumption of a climate CO2 connection.

THE CURRENT VIEWS ON CO2 AND CLIMATE CHANGE

The causes, development and future projection of climate change are summarized in the reports of the Intergovernmental Panel on Climate Change (IPCC), a United Nations body that is responsible for advising governments. The four consecutive Assessment Reports of the IPCC - issued in 1992, 1995, 2001 and 2007 - follow closely the views of three influential scientists, Arrhenius, Callendar and Keeling on the importance of CO2 as a control on climate change.

Quote from Keeling (1978, p. 1 [1]). "The idea that CO2 from fossil fuel burning might accumulate in air and cause a warming of the lower atmosphere was speculated upon as early as the latter half of the nineteenth century (Arrhenius, 1903). At that time the use of fossil fuel was too slight to expect a rise in atmospheric CO2 to be detectable. The idea was again convincingly expressed by Callendar (1938, 1940) but still without solid evidence of a rise in CO2."

Following this line of argument, the IPCC's Third Assessment Report (IPCC, 2001, chapter 3.1 [2]) contained the further explanation which makes it entirely explicit that direct measurements can only be relied on post 1957 and prior direct measurements can be disregarded in favour of indirect measurements made of air trapped in ice: "The concentration of CO2 in the atmosphere has risen from close to 280 parts per million (ppm) in 1800, at first slowly and then progressively faster to a value of 367 ppm in 1999, echoing the increasing pace of global agricultural and industrial development. This is known from numerous, well-replicated measurements of the composition of air bubbles trapped in Antarctic ice. Atmospheric CO2 concentration have been measured directly with high precision since 1957; these measurements agree with ice-core measurements, and show a continuation of the increasing trend up to the present."

In 1958 C.D. Keeling, University of California, San Diego, USA, introduced a new technique for the accurate measurement of atmospheric CO2. Keeling used cryogenic condensation of air samples followed by NDIR spectroscopic analysis against a reference gas, using manometric calibration. Subsequently, this technique was adopted as an analytical standard for CO2 determination throughout the world, including by the World Meteorological Association (WMO) [3, 4, 5, 6, 7, 8, 9, 10, 11, 12, 13].

CO2 measuring stations are distributed across the globe. Most, however, are located in coastal or island areas in order to obtain air without contamination from vegetation, organisms and industrial activity, i.e. to establish the so-called background level of CO2. In considering such measurements, account should be taken of the established fact that land-derived air flowing seawards loses about 10 ppm of its carbon dioxide to dissolution in the oceans, and even more in colder waters (Henrys Law).

THE ESTABLISHED CRITICAL VIEW ON HISTORICAL CO2 DATA

A major issue regarding the IPCC approach to linking climate and CO2 is the assumption that prior to the industrial revolution the level of atmospheric CO2 was in an equilibrium state of about 280 ppm, around which little or no variation occurred. This presumption of constancy and equilibrium is based upon a critical review of the older literature on atmospheric CO2 content by Callendar and Keeling. (See Table 1). Between 1800 and 1961, more than 380 technical papers that were published on air gas analysis contained data on atmospheric CO2 concentrations. Callendar [16, 20, 24] Keeling and the IPCC did not provide a thorough evaluation of these papers and the standard chemical methods that they deployed. Rather, they discredited these techniques and data, and rejected most as faulty or highly inaccurate [20, 22, 23, 25, 26, 27]. Though they acknowledge the concept of an 'unpolluted background level' for CO2, these authors only examined about 10% of the available literature, asserting from that that only 1% of all previous data could be viewed as accurate (Muentz [28, 29, 30], Reiset [31], Buch [32]).

THE CHALLENGE OF THE MAIN STREAM VIEW ON THE HISTORICAL DATA

During my own review of the literature, I observed that the evaluation of Reiset's and Muentz's work by Callendar and Keeling was erroneous. This made me investigate carefully the criteria that were used by these and other authors to accept or to reject such historical data. The data accepted by Callendar and Keeling had to be sufficiently low to be consistent with the greenhouse hypothesis of climate change controlled by rising CO2 emissions from fossil fuel burning. Callendar rejected nearly all data before 1870 because of "relatively crude instrumentation" and reported only twelve suitable data sets in 20th century as known to him [20] out of 99 made available by Stepanova 1952 [18].

The intent of these authors was to identify CO2 determinations that were made using pure unpolluted air, in order to assess the true background level of CO2. Callendar set out the criteria that he used to judge whether older determinations were "allowable" in his 1958 paper [20] which presents only data that fell within 10% of a longer yearly average estimated for the region, and also rejected all measurements, however accurate, that were "measurements intended for special purposes, such as biological, soil air, atmospheric pollution".

Next I cite the conclusion of the analysis of 19th centuries CO2 data by Keeling back in 1986 (From/Keeling 1986, pp. 101-103 [23]): "Our original goal was to find, if possible, a seasonal cycle in the nineteenth century atmospheric CO2 data in agreement with modern observations by applying the air mass criteria of Callendar (1940a) to screen out contaminated data. This goal we have demonstrated to be unachievable. We find, after screening out suspicious data on the basis of air mass, that none of the five data sets of Callendar show the seasonal cycle which Callendar found in combination. Brown and Escombe (1905b) investigated atmospheric carbon dioxide only as a sideline to botanical studies. They provide minimal information on methodology and weather conditions. A few of their data seem abnormally low. Their sampling was sporadic over a four year period at a site poorly chosen to study CO2, albeit convenient to their botanical laboratory. Their results are of interest mainly because they used an apparatus similar to Reiset's which had been carefully tested by an independent method." "In conclusion, the measurements of atmospheric carbon dioxide carried out by Reiset (1882) from 1872 to 1880 on the coast of northern France appear to be valid. They indicate a mean annual concentration, with respect to dry air, of 292.4 ~ 1.2 ppm. Comparisons with other possibly valid contemporary data suggest that these data are not biased by more than 10 ppm. It is thus unlikely that the CO2 concentration was less than 282 ppm in the late nineteenth century, and was probably close to 292 ppm."

There was no verification or falsification of results and methods used by other authors, especially those published in the 20th century (e.g. Lundegardh [35, 36], Duerst [37], Kreutz[38], Misra [39], Scholander [40]), with exception of Buch 1935 [32], lying on the "fuel line" (Callendar 1958 [20]). According to Callendar, Keeling and the IPCC, CO2 variations to be observed in air were due diurnal, and seasonal cycles, or to glacial/ interglacial fluctuations. Natural concentrations are assumed to have been in equilibrium until mankind disturbed the natural situation. In this way, any long term observations that might display decadal to centennial natural variations in atmospheric CO2 are ruled out a priori by Callendar and Keeling. As I discuss further below, these criticisms by Callendar and Keeling, and the selective way in which they discarded previous data, are not able to be justified. Their most egregious error was perhaps the dismissal of all data which showed variations from their presupposed average. That said, it is of course the case that some of the older data has to be viewed as less reliable for technical, analytical reasons, as also indicated below.

[...]

DISCUSSION AND CONCLUSIONS

During the late 20th century, the hypothesis that the ongoing rise of CO2 concentration in the atmosphere is a result of fossil fuel burning became the dominant paradigm. To establish this paradigm, and increasingly since then, historical measurements indicating fluctuating CO2 levels between 300 and more than 400 ppmv have been neglected. A re-evaluation has been undertaken of the historical literature on atmospheric CO2 levels since the introduction of reliable chemical measuring techniques in the early to middle 19th century. More than 90,000 individual determinations of CO2 levels are reported between 1812 and 1961. The great majority of these determinations were made by skilled investigators using well established laboratory analytical techniques. Data from 138 sources and locations have been combined to produce a yearly average atmospheric CO2 curve for the northern hemisphere.

The historical data that I have considered to be reliable can, of course, be challenged on the grounds that they represent local measurements only, and are therefore not representative on a global scale. Strong evidence that this is not the case, and that the composite historical CO2 curve is globally meaningful, comes from the correspondence between the curve and other global phenomena, including both sunspot cycles and the moon phases, the latter presented here probably for the first time in the literature, and the average global temperature statistic. Furthermore, that the historical data are reliable in themselves is supported by the credible seasonal, monthly and daily variations that they display, the pattern of which corresponds with modern measurements.

It is indeed surprising that the quality and accuracy of these historic CO2 measurements has escaped the attention of other researchers. How to interpret the monthly variation of CO2 (see Fig. 5, 7, 9 and modern measurements e.g. Mauna Loa), which indicates a coincidence with the lunar phases, is another question to be dealt within a paper in preparation.

Modern greenhouse hypothesis is based on the work of G.S. Callendar and C.D. Keeling, following S. Arrhenius, as latterly popularized by the IPCC. Review of available literature raise the question if these authors have systematically discarded a large number of valid technical papers and older atmospheric CO2 determinations because they did not fit their hypothesis? Obviously they use only a few carefully selected values from the older literature, invariably choosing results that are consistent with the hypothesis of an induced rise of CO2 in air caused by the burning of fossil fuel. Evidence for lacking evaluation of methods results from the finding that as accurate selected results show systematic errors in the order of at least 20 ppm. Most authors and sources have summarised the historical CO2 determinations by chemical methods incorrectly and promulgated the unjustifiable view that historical methods of analysis were unreliable and produced poor quality results


When greenies cherry pick their "facts", they can show what they want, or more to the point, what keeps the checks coming!
 
Status
Not open for further replies.

Tractor & Equipment Auctions

2019 John Deere Gator HPX615E 4x4 Utility Cart (A49346)
2019 John Deere...
TPM 16 Mini Excavator (A49251)
TPM 16 Mini...
Case International JX95 4WD Tractor w/ Loader (A49251)
Case International...
2005 Ford Expedition (A47371)
2005 Ford...
Deutz 6 Cylinder Engine (A49251)
Deutz 6 Cylinder...
TERMS & CONDITIONS (A49251)
TERMS & CONDITIONS...
 
Top