How is the virus affecting you?

Status
Not open for further replies.
   / How is the virus affecting you? #321  
Memo from HR lists the following as possible reasons to refuse return to work

Over 65
Live with someone over 65
Underlying Health Condition normally not Medical Leave Eligible.
High Risk Travel
Concern about being in the workplace...

The last one would seem to leave the door wide open


Yep. It’s wide open. If they say they fear getting CV from working they can draw UI and the additional $600 added by the Feds (you and me) for up to 4 months.

The Senate tried to add an amendment to cap the UI at 100% of an individual’s salary. It needed 60 votes to pass and the vote was 48-48 so it failed.
 
   / How is the virus affecting you? #322  
I really don't like those charts, primarily because they should show the line going back down as well, not just it going up into the stratosphere.

Aaron Z

That chart is deaths by weeks for each event. 2017-2018 flu and pneumonia, 2017-18 flu, '57-'58 Asian flu with pneumonia, car crashes, etc.... it shows the increase in deaths by week of each one of those events as they happened. With the exception of the cancer and heart disease lines, those are not averages, but actual deaths per week. The chart clearly shows that the Covid-19 killed a lot more people in a lot shorter time than those other events. If you look, they go up and down throughout the year. The 57-58 asian flu had another upswing starting in week 19. The Covid-19 hasn't started a downswing that is noticeable on the charted numbers as of yet. I'd like to see them keep updating this chart throughout this event and see how it pans out.

People try to compare the death totals to the flu, which might end up being less-same-more, but it's clearly not the same time-wise. This one is harsher, faster. We won't know until it's over, just how it compares to other events.
 
   / How is the virus affecting you? #323  
you do, you can choose not to go back to work but when the unemployment office finds out that you chose to not go back to work, not only will they cut off your unemployment, but you will have to repay the unemployment that you were paid from when you were called back until they shut it off.
At least, that is how it works here in New York.

Aaron Z

Same way it works here. If your job is eliminated, you have to look for other work. If you've been laid off with probable chance of going back, you're exempt from having to look for other work for X weeks. If you get called back and don't go, you can't keep collecting.
 
   / How is the virus affecting you? #324  
That chart is deaths by weeks for each event. 2017-2018 flu and pneumonia, 2017-18 flu, '57-'58 Asian flu with pneumonia, car crashes, etc.... it shows the increase in deaths by week of each one of those events as they happened. With the exception of the cancer and heart disease lines, those are not averages, but actual deaths per week. The chart clearly shows that the Covid-19 killed a lot more people in a lot shorter time than those other events. If you look, they go up and down throughout the year. The 57-58 asian flu had another upswing starting in week 19. The Covid-19 hasn't started a downswing that is noticeable on the charted numbers as of yet. I'd like to see them keep updating this chart throughout this event and see how it pans out.

People try to compare the death totals to the flu, which might end up being less-same-more, but it's clearly not the same time-wise. This one is harsher, faster. We won't know until it's over, just how it compares to other events.


And that chart is nationwide totals. So it doesn’t smooth out the data to account for the high number of deaths in one or two cities which drive up the total. If you took out NYC the total would be much lower.

Looking at a total number without taking into account where the numbers are coming from gives a very distorted view of the whole picture (chart).
 
   / How is the virus affecting you? #325  
That chart is deaths by weeks for each event. 2017-2018 flu and pneumonia, 2017-18 flu, '57-'58 Asian flu with pneumonia, car crashes, etc.... it shows the increase in deaths by week of each one of those events as they happened. With the exception of the cancer and heart disease lines, those are not averages, but actual deaths per week. The chart clearly shows that the Covid-19 killed a lot more people in a lot shorter time than those other events. If you look, they go up and down throughout the year. The 57-58 asian flu had another upswing starting in week 19. The Covid-19 hasn't started a downswing that is noticeable on the charted numbers as of yet. I'd like to see them keep updating this chart throughout this event and see how it pans out.

People try to compare the death totals to the flu, which might end up being less-same-more, but it's clearly not the same time-wise. This one is harsher, faster. We won't know until it's over, just how it compares to other events.


And that chart is nationwide totals. So it doesn稚 smooth out the data to account for the high number of deaths in one or two cities which drive up the total. If you took out NYC the total would be much lower.

Looking at a total number without taking into account where the numbers are coming from gives a very distorted view of the whole picture (chart).
 
   / How is the virus affecting you? #326  
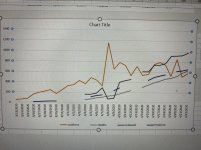
This is chart for MD for the last month.
Top line = total cases
2nd line = current cases(total-deaths-recovered)
3rd line = total hospitalized

IMG_4081.JPG

Here’s closer look at bottom lines that is in the noise.
Number recovered
Number increase cases per day
Number of cases in our county
Number deaths in the state.


IMG_4082.JPG
 
   / How is the virus affecting you? #328  
Are you in Frederick? My son plays lacrosse at The Mount. :)
 
   / How is the virus affecting you? #329  
Aren’t the highest numbers nationwide (cases and deaths) in the NYC, NJ, MD area? With the most anywhere in NYC?

Don’t know about MD, but NYC and North Jersey are the epicenters.
I was listening to the radio about a MIT study which found that the New York City Metro Transit system trains, buses and subways may be the single biggest transmission points for the virus.
 
   / How is the virus affecting you? #330  
And that chart is nationwide totals. So it doesn’t smooth out the data to account for the high number of deaths in one or two cities which drive up the total. If you took out NYC the total would be much lower.

Looking at a total number without taking into account where the numbers are coming from gives a very distorted view of the whole picture (chart).

There's nothing distorted about the numbers. Those are the numbers for the country as a whole. If you want to take pieces of the whole and analyze those, those are fractions of the whole. NY, Michigan, etc... they're all in the same country.
 
Status
Not open for further replies.

Tractor & Equipment Auctions

2015 INTERNATIONAL PROSTAR TANDEM AXLE SLEEPER (A52141)
2015 INTERNATIONAL...
2017 Caterpillar 259D Two Speed Compact Track Loader Skid Steer (A50322)
2017 Caterpillar...
CASE IH 580 QUADTRAC ARTICULATING TRACTOR (A51243)
CASE IH 580...
UNUSED FUTURE STUMP GRAB BUCKET (A51244)
UNUSED FUTURE...
2004 JOHN DEERE 5205 TRACTOR (A51406)
2004 JOHN DEERE...
New 4-235/80R16 Montreal Trailer Tires (A50774)
New 4-235/80R16...
 
Top