Industrial Toys
Super Star Member
- Joined
- Feb 25, 2008
- Messages
- 17,407
- Location
- Ontario Canada
- Tractor
- Kubota R510 Wheel Loader + Cab and backhoe, JD 6200 Open Station, Cushman 6150, 4x4, ten foot 56 hp Kubota diesel hydraulic wing mower, Steiner 430 Diesel Max, Kawasaki Diesel Mule, JD 4x2 Electric Gator
Still trying to understand this. Much information on the Internet and Youtube but mostly people just Parroting information they heard or read about, without any real technical understanding. Just take this wire off here and attach it here to make it work, kind of thing.
So forget about the derating for a moment. How can you take two legs of a three phase generator that are 120 degrees out of phase and use them to replace a single (split) phase 120/240 winding coming out of your utility transformer? It may work, but can't be the same????
As far as the 208 vs 240 goes. I just remembered a Fiasco from last summer. I was asked to provide the controls for a hydraulic pump on a tilting table for processing bagged fire wood. The pump was 240V as ordered by a friend for the friend I was working for, and as requested by the customer, or was it an assumption?
Anyway it kept tripping out when delivered to the customer. A lot of head scratching and wasted man hours, only to discover that the customer has 208 feeding his cord ended (240V) receptical. They ended up putting in a transformer.
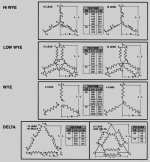
 Are those for different versions of alternators?
